Perkins DNA Update

Some interesting news on the Perkins front since the publication of my earlier DNA articles. I found a male Perkins cousin (let’s call him LP) who is a second cousin to my mother, WAB, and her sister JB. They all share a common ancestor of Jacob and Jennie (Jardine) Perkins. LP showed up on ancestryDNA through his autosomal DNA, and he was kind enough to submit to Y-DNA testing through familytreeDNA. Y-DNA is passed only from father to son. With it, you can compare DNA from other male Perkins ancestors, including and beyond John Perkins who sailed to Massachusetts in 1631. Below are the top 10 matches listed by familytreeDNA for LP’s Y-DNA.

The Original Top Ten Y-DNA Matches to LP, a male Perkins Descendant

Whoops. Across the board, the testers name the earliest know ancestors as a “Loomis” not a “Perkins”.  Shock, led to disbelief, then sadness since I really enjoyed researching all the members of the Perkins branch. With acceptance, I am finally able to study the results.

Out of a total of 37 test points, the closest match is 34/37. Ideally, all Y-DNA moves perfectly through the generations from father to son. However, mutations happen. Generally, the more generations, the more mutations. In this case 3 to 4 mutations occurred between a given Loomis men in the table and our LP. So the results suggest that the common Loomis male occurred many generations ago because it takes time for Y-DNA to mutate. How long ago? It’s all statistics as shown by the table to the right.

If you take the first match in the list, JPL, there is roughly 50% chance they share a common father after 6 generations. For reference, there are 13 generations from LP to John Perkins of Ipswich. So this DNA suggests that there about 93% chance that JPL and LP share a common father within those 13 generations. Stated another way, it’s highly likely one of these Perkins males listed below had a Loomis father.

Probability LP and JPL share a common ancestors
Thirteen Generations of male Perkins Descendants from John Perkins of Ipswich, MA

Now, let’s look at LP’s autosomal DNA results in the form of the ancestry Thrulines. As noted in a previous article (“DNA of WAB, Pt 1”), Thrulines combines user submitted tree with shared DNA to form descendant trees. While not perfect, due primarily to faulty trees, they do show shared matches down to 8 cM which is really helpful for these distant ancestors. Notice that Ely’s children show lots of matches, but his father, Francis Perkins, shows none.

This result may be significant, but it fails to prove that Ely is unrelated to Francis because there are other viable explanations. The autosomal DNA may have become too diluted below 8 cM. More importantly, Ely needs to have a sibling with descendants. In Ely’s case, we know of two brothers: Rev. Cyrus Peck Perkins and Dr. William Francis Perkins. There doesn’t not seem to be many testing descendants for either one.

ThruLine of Francis Perkins for LP

The migration of Francis and Elizabeth to Nova Scotia in 1762 became the source of family legend. Edmund Cogswell, grandson of Ely and Sarah (DeWolf) Perkins, lived with his Grandmother until Sarah died in 1865 . He wrote to his cousin in Jamaica in 1886. This letter eventually made it way into the Jamaican archives.

This same story made its way in the 1909 book “The Descendants of Edward Perkins of New Haven, Conn.” The author, Caroline Perkins, found additional descendants to expand the story to include all the Perkins family members who first moved to Lyme.

The descendants of Edward Perkins by Caroline E Perkins, 1914
Perkins Family of Lyme (source: archive.org)
1886 Letter from Edmund Cogswell in Nova Scotia to Robert Perkins of Jamaica (source: Jamaican Archives)

How to make sense of this data? At this point, based on the DNA and the paper evidence, I feel confident that children from Ely and Sarah (DeWolf) Perkins onwards are part of the Perkins genealogy. On the other hand, Ely himself remains problematic, and could be the son of a Loomis. If you go back to the 13 generation chart above, you can now limit the search to Ely, Francis, Abraham b. 1713, Abraham b. 1671, Isaac b. 1650, John b. 1608 and John b. 1583 as males Perkins being born by a male Loomis. 

Now let’s look at the Loomis side of the equation. Based on the movements of the the Perkins men, we need a Loomis living nearby to either Ipswich, MA or Lyme, CT. Best-known is Joseph Loomis who arrived in America in 1638 before settling in Windsor, Connecticut. The 10 testers in the Y-DNA list all seem connected to him. Research of the tree suggests that Joseph goes back to Essex county in England in the 1500’s.  While not many Loomises can be found in Lyme, many settled as close as Colchester located in northwest New London county.  From the epic “The family of John Perkins of Ipswich, Massachusetts” by George Perkins, 1882, notice this cryptic mention of Colchester:

“245 Francis (Abraham, Abraham, Isaac, John, John ) was born in Lyme, Conn., on Monday, Dec. 14, 1741. He married — Lee, of Colchester, Conn. He is said to have removed to Halifax, N.S., and afterwards to Haston (?).”

Francis actually married a Peck (not a Lee), and they went to Horton (not Haston), but she could have been living in Colchester. On the other hand, there is also an Ipswich, MA angle to consider. From the equally epic “Descendants of Joseph Loomis in America: And His Antecedents in the Old World.” by Elias Loomis, 1909, we see this passage:

“Other families of the Loomis Name. – Besides the descendants of Joseph Loomis of Windsor, there are in the United States other families known by the name of Loomis, Lummis, or Lomas. Edward Lomas, born about 1606, came from London in 1635, and settled in Ipswich, Mass.;”

So we have an early Loomis arriving 1635 in Ipswich. Research indicates that this Edward also emigrated from Essex county in England, and is related to Joseph Loomis of Windsor. Unfortunately, there appears to be no individuals in the Loomis Y-DNA database who claim a tie with Edward. We can, at least, rule out John Perkins b. 1583 and John Perkins b. 1608 since they were born in Warwick county, far from Essex.

At this point, LP and I made contact with Howard Loomis who oversees the Loomis Y-DNA website. He convinced LP to expand his 37 test result to the “Big Y” which, as the name implies, is very big and comprehensive. Not only was the STR marker count increased from 37 to 111, but a new type of mutation, called a SNP, got tested as well. Below are the top matches at 111 SNP test points to LP. The “winner” of the closest match is MDL.  JPL, closest match from the 37 test, does not show up because his test does not include 111 markers.

The Case for a Colchester Loomis
If we look at the tree of these closest matches, we see the Colchester Loomis names.  To the right are the male linage for MDL, the best 111 test match and JPL, the best 37 test match. Two Perkins men, Frances and Ely, were born in Lyme. Two Loomis men, Daniel and John, were living in Colchester around the same time. 

There is more. The nexus between Loomis of Colchester and Perkins of Lyme centers around the Peck family. Francis Perkins married Elizabeth Peck before they travelled with some of Elizabeth’s family to Nova Scotia. In Wesley Brown Church located in Salem, CT, lie the burial stones of Elizabeth’s father, Benjamin, and her brother, Elias. Also buried there in 1811 is John Loomis. You can see these cemetery listings in the link below, which includes a map showing Salem located between Colchester and Lyme:
Wesley Brown Cemetery Burials

I have to say that this evidence points to Ely being a possible child of a Loomis father, so allow me to focus on him for a bit. Ely was the oldest of three sons born about 1762 to Frances and Elizabeth (Peck) Perkins. He was likely named (some irony here) for Francis’ mother, Elizabeth (Ely) Perkins, who died a few years earlier in 1759. His parents were in the middle of moving from Lyme, Connecticut to Horton, Nova Scotia. His next brother, William Francis Perkins, would have been born seven years later in Nova Scotia. The third brother, Cyrus Perkins, was born another seven years later. There is no record of any of these births. However, they are all named in their father’s will. William Francis Perkins became a doctor, and moved to Jamaica where many descendants live today including elusive Y-DNA worthy males. Cyrus Perkins joined the Church of England, and settled in Annapolis, Nova Scotia. Not a lot of descendants survive from this line. Most connect to the Goucher surname with no male Perkins remaining.

Comparison of LP's Perkins line to MDL (closest 111 marker match) and JPL (closest 37 marker match)

I have been working with a Jamaican descendant of Dr. William Francis Perkins in hopes of connecting Francis to Ely. JLS has been kind enough to let me analyze her DNA. Jamaica genealogy research is hard. Records are not as good, and not as many people have tested. However, that said, we are beginning to see a DNA picture emerge. To date, the only Perkins ThruLine connects Henry Perkins son of Dr W F Perkins.  The doctor has other lines, but I have not found any DNA links to them yet.

There is an open offer of free Y-DNA testing to any male Perkins willing to test.

ThruLine for Dr William Francis Perkins for JLS
Family Tree for Francis & Elizabeth (Peck) Perkins showing their 3 Sons. LP and JLS ThruLines shown in Red Boxes

The Case for an Ipswich Loomis
The Colchester connection seems so obvious – until it doesn’t. To understand an alternative theory, we need a quick tutorial about Y-DNA mutations. The STR (short tandem repeat) serves as the basis of the 37, 67 and 111 marker Y-DNA tests. It is a count of the number of times that a small snippet of DNA repeats at a given marker. In the table below I have published the STR data for LP and nine close matches who also happen to have a published tree. Most of the marker counts remain constant. When a mutation occurs, the count will increase or decease by 1. Ideally, a STR mutation would signal a branch in the family tree. Let’s call that a “branch mutation”. For example, at marker 55, the three individuals in red (our LP, JHL and MDL) might all represent a single branch in the Loomis tree. Unfortunately, it does not always work out that way. (1) A mutation that goes up one can turn around and go back down one, making it look like no change happened. (2) Mutations can occur in parallel. That is, a same marker can change in separate branches. Let’s call them a “parallel mutation”.

Raw STR results for LP and 9 other Loomis descendants who all have published trees. "Group Modal" row provides a starting, baseline point (source: jdvsite.com)

These parallel mutations can drive you crazy. Here’s my way of dealing with them. The rate of mutation varies with the marker. The table to the right shows the list of relevant markers ranked in terms of mutation rate. For example, you can see that markers 34 and 35 mutate frequently.  These high mutation rate markers are most likely to create parallel mutations. On the other hand, makers with low mutation rate are likely associated with branch mutation. 

I assumption that the top 5 marker could easily produce parallel mutations. It makes little sense to force a branch out of them. For the rest, I try and make them branch mutations, if possible.

By the way, the rate of change for markers 34 and 35 is so high that I arbitrarily decided to exclude these markers from my analysis below. It does not add any understanding.

Marker NumberMarker NameRank (out of 111)Mutation Rate per GenerationTotal Mutations
34CDYa10.018774
35CDYb20.018773
9471230.018771
2144940.009392
3257650.009391
55534100.006263
9439130.004692
24464c150.004691
78549180.004691
12389ii-i280.003131
29YCAIIb510.001711

Howard fed all of the Loomis results in a sophisticated computer program called SAPP which creates a tree based on the sequence and rates of mutations. SAPP consistently predicts that the common ancestor between LP and the other matches occurs further back in time than Colchester. In order words, this computer program predicts an Ipswich Loomis for our ancestor. To understand this result, I created two scenerios, a Colchester Loomis and an Ipswich Loomis, with the known trees of the subgroup in the table above and with markers 34 & 35 omitted. In the first scenerio, I put Ely as a son as early as John Loomis b. 1741 of Colchester, that scenario left many mutations to occurs over a short period of time. An Ipswich Loomis would give the superior timeframe for the mutation to occur.

Possible sequence of mutations assuming common ancestor for MDL and LP is John Loomis b. 1741 of Colchester. MDL and LP share a branch mutation at marker 534, but Ely would need to produced 3 mutations (439, 389i, & 449) over the next seven generations. That’s a lot of mutations over a short amount of time. Notice that the other descendants from John Loomis b. 1622 have between zero to two mutations.

Here LP is part of the Ipswich Loomis branch. I changed the baseline value of marker 439 to 12, then created a branch mutation at marker 439 to 11 in front of John Loomis b 1622 so that all descendants of John carry this mutation.  LP is left with three mutations, two of which are parallel, 449 (rank 4) and 534 (rank 10). Not fond of the two parallel mutations, but overall the mutations appear more balanced across all the branches.

This conclusion would point to either Isaac b. 1650, Abraham b. 1671 or Abraham b. 1713 as being the son of a Loomis. The paper trail is too thin to name a suspect (so to speak) at this point. As we get closer to the original John Perkins, we should hopefully see some overlap with testers in the Perkins Y-DNA website.  

There is another form of mutation that is part of the Big Y test. It is called a SNP (single-nucleotide polymorphism). These mutations stay put and are unique. But they tend to occur less frequently and therefore go back further in time. The sequence of SNP’s defines your haplogroup. LP’s is a R-BY17805. It occurred sometime after the year 1600. Since the Loomis men arrived to America about this same time, it is impossible to use this information to differentiate a Windsor Loomis from an Ipswich Loomis.  However, the result is still important because it proves that LP belongs with the Ipswich/Windsor Loomis men.

The Y-DNA analysis continues to evolve, so anticipate changes to this article as new results, including Y-DNA, emerge. As mentioned, there is a standing offer to provide a test to any male Perkins or Loomis who could add to this body of evidence.

Categories DNA

DNA of WAB, Pt 8: The Nicklos Subgroup

The Nicklos subgroup arises from the DNA of Charles Nicklos born in Saxony, Germany mixed with the DNA of Jessie McDowell born in Scotland. They met in Canada, moved to Galicia, before finally settling in California. 

In Part 1, a cluster analysis was done on the DNA of WAB to see how the family tree mapped out. Baker, Perkins and Woods subgroups were identified, but no obvious Nicklos cluster. In Part 2, the unidentified DNA matches and clusters were analyzed to look for any signs of the Nicklos subgroup. A few matches were identified.

The Nicklos Subgroup: Known Ancestors of Ernest James Nicklos

Since this original analysis, additional DNA testing has been completed by others. Introducing JD, a sister to WAB, and JN, a first cousin. Let’s call this group “the grandchildren” for obvious reasons.  Using their collective results, new shared matches can be identified and added to the McDowell and Nicholas lists.

McDowell DNA Analysis

The table to the right shows a working list of McDowell shared matches. The shared match with JL is significant because the grandchildren share a common ancestor in James McDowell and Isabella McLeod making them second cousins, x1 removed. JL represents their closest known McDowell relative.

JLankton, and DarthTorment are also closely related to each other, likely first cousins, 1x removed based on their trees. They trace themselves to John McDowell b. 1789 in Ayr Scotland. bsinc204 also has a published tree to this John McDowell. SLankton is likely a child of JLankton based on their user name. libertyandersonsweeny’s tree is private, but will probably trace to John McDowell.

Match NameLength of Match (cM)Useful Tree?
WABJDJN
JL2311772Yes
JLankton9721107Yes
SLanktonNone1223Yes
libertyandersonsweeny251926No
DarthTorment22None27Yes
bsinc2041520NoneYes
Descendants of James and Isabella (McLeod) McDowell
Descendants of John and Helen McDowell

So how is this John related to our James McDowell? Several probabilty charts have been done that show the odds of a particular relationship based on the amount of shared DNA. Ancestry has one, as does DNA Painter. To the right is the chart for JN’s shared match of 107 cM to JLankton. Notice that table suggests a close relationship – on the order of second cousin.  So let’s look at three scenarios showing how John McDowell could be related to James McDowell based on the two trees above.

Odds JN is related to JLankton (source: DNA Painter)

Scenerio 1: James is the father
In this case, JLankton has the wrong parents for Elizabeth McDowell born in 1935. James would be age 19 when Sarah Banks was born in 1829, and age 53 when Jessie was born in 1860. Then JLankton and the grandchildren would be half 3nd cousins. Odds at 10.3% for a 107 cM match to JN, but only 3.0% for the 21 cM match to JD. This solution conflicts with 1841 and 1851 Scottish censuses showing Elizabeth and Sarah as daughters of John. Also, there are two daughters named Sarah.

Scenerio 2: John is the father
John McDowell (b. 1789) would have been age 18 when James was born in 1807 and age 46 when Elizabeth was born in 1835. JLankton and the grandchildren would be half 3rd cousins x1 removed. Odds now 4.5% for a 107 cM match to JN, 5.4%. Another problem is that John and Helen had a second son in 1828 named James even though the first James was still alive.

Scenerio 3: John and James are brothers.
JLankton and the grandchildren would be 4th cousins. Odds remain 4.5% for the 107 cM match to JN, 5.4%. Biggest problem is the 18 year difference in birth years between John and James.

It will take some more time to sort out the McDowell relationships. All these scenerios have problems. The probability chart assumes none of the dreaded endogamy or pedigree collapse, which may be present and would increase the shared match of JLankton. Going back further in time has additional problems: (1) McDowell and its variations is a pretty common name. (2) Records are becoming spotty. (3) No additional DNA matches have surfaced to date. Despite these negatives, the DNA here has given us a good place to focus future research. We have identified new relatives. We just need to see how we are related.

Nicklos DNA Analysis

Now let’s look at the Nicklos DNA. The table to the right is based on the flimsiest of connections. Mystery matches LC and EW share DNA with JJ. The tree of JJ points to an Elsie Stolz of Milwaukee who lists her county of birth in 1873 as Saxony, the same as Ernest Nicholas.  With the combined DNA of the grandchildren, the table got expanded, but only by a few matches including DJ and TG.

Match NameLength of Match (cM)Useful Tree?
WABJDJN
LC7713547Yes
EW584864No
JJ292418Yes
DJ181823Yes
TG382436Yes

Both LC and EW kindly replied to email inquiries. Whereas EW had absolutely no idea about her tree due to her adoption, LC and I have had many productive exchanges. He even allowed me to incorporate his DNA. LC’s maternal grandfather, Joseph Lewczak, filed a naturalization petition where he states that he was born 1899 in “Krosno, Austria”. Guess who also lived here? The Perkins/Nicklos families resided in or near Krosno during this same time in an area variously called Galicia, Poland, Ukraine and Austria.

Naturalization Paper for Joseph Lewczak which names Krosno, Poland as birthplace in 1899

Now we see a possible connection. Joseph Lewczak (b. 1899) married Eva Czystor (b. 1893) in 1916 in Connecticut. We know very little about Eva so we must be open to the fact that she, too, might have emigrated from the same region. In other words, either Joseph or Eva represents the best source of our shared DNA with LC. Our Perkins and Nicklos families resided at the same time in Krosno. One of them likely supplied DNA to Joseph or Eva. To be fair, we need to consider everyone, both male and female, of potential child bearing age that might have lived in or near to Kronso at that time (see tree below). Then we can rule them out.

All of these individuals could have lived in Galacia about 1895

Although a few of the Perkins men lived checkered lives as youths, we can likely rule out descendants of James and Mary (Vansickle) Perkins. They passed DNA to many individuals tested on ancestry.com, as shown in the chart below. One would expect to see some small amount of Perkins or Vansickle DNA in the shared match with LC. To date, no evidence of any of this DNA shows up. By the same logic, we can so far rule any children of Charles and Jessie (McDowell) Nicklos. We identified McDowell DNA matches above. Any children of Charles and Jessie would be expected to contribute some McDowell DNA to any LC. Nothing is found down to 8 cM. Therefore, we can rule out these children for now.

ThruLine for James Perkins showing everyone who share DNA with WAB

We are left with one likely source of the DNA…Charles Nicklos. Currently, every piece of evidence suggests that he passed DNA to either Joseph Lewszak or Eva Czystor when he lived in Galicia. LC would be a half 2nd cousin to the grandchildren. The proposed family tree is shown below. It introduce a new individual, TA, who should also be related. Here are some observations:

  1. You could figure out whether Charles is the father of Joseph Lewczak by testing a descendant of GL. Any positive DNA match would indicate that Joseph is the child of Charles. You could also test a sibling of Eva Czystor. Any positive DNA would indicated that Eva is the child. 
  2. TA and EW share about the same amount of DNA with LC meaning that TA and EW may be a stepsisters. 
  3. Notice that EW shares DNA with us, but TA does not.  This is a little surprising. TA may still be related. “No DNA Shared” can mean that the value may be <8 cM. However, both individuals are NPE’s. The results could also mean that TA’s relationship to LC is not yet fully understood.
  4. It would be very interesting to test a descendant of Gertrude May Nicklos for a match to LC because they have Nicklos & McDowell but no Perkins & Vansickle DNA.
Updated Descendant Tree for Charles Nicklos based on the DNA evidence

Please realize that these results are not set into stone. New data or different conclusions can always emerge. However, keep in mind that if Charles get exonerated, someone else gets implicated. For those that find this new family narrative a little disconcerting, welcome to the wild west that is DNA testing. Fortunately, this event took place 120 years ago. Enough time has hopefully passed so that we can welcome this new version of the family tree.

Ernest & Charlotte (Zieryacks) DNA
As to any connections to Ernest Nicklos or his wife Charlotte Zieryacks, the grandchildren have three matches left: JJ, DJ and TG, all of whom descend from of Charles and Elsie (Stolz) Laatz.  Although we could be related to either Charles or Elsie, only Elsie states that she was born in Saxony, Germany. 

Elsie (1873-1945) immigrated to Milwaukee, WI around 1891 with Carl Stolz and Elizabeth Mueller, who she names as her parents on her marriage certificate. However, Elizabeth was her stepmother. Elsie had a sister, Lena, who names their mother as “Henriette Blank” and a bother, Otto, who names her as “Catherine Planke”.  Elsie turned 12 when Carl married Elizabeth in 1885 as shown in the following marriage certificate. 

from “Erfurt, Germany, Marriages, 1874-1900” (ancestry.com)
On 11 Jul 1885 in Erfurt, Thuringen, GER, Carl Heinrich Stolz, 40, born 21 Oct 1844, son of Johann Balthasar Stolz and Sophie Elisabeth Stolz, married Eva Elisabeth Mueller, 32, born 14 Dec 1852, daughter of Carl Traugott Mueller and Anna Rebecca Mueller.

Carl and Elizabeth did have children including a son, Paul, born in 1889. During the coarse of this analysis, one other match emerged who descends from Paul. This match, JB, shares a measly 10 cM with WAB only. However, if we believe all these matches, then only Carl Heinrich Stolz provides the DNA path to Ernst Nicholas or his wife Charlotte Zieryacks. Using the marriage record above which names Carl’s parents as Johann Balthasar Stolz and Sophie Elisabeth Stolz, we find this new marriage record:

from “Thuringia, Germany, Lutheran Baptisms, Marriages, and Burials, 1591-1875” (ancestry.com)
On 1839 in Waltershausen, Thuringen, GER, Johann Bathasar Stolz son of Anna Barbara Stack married Sophie Elisabethe Nicolai daughter of Johann Georg Nicolai.

Updated Nicklos Family Tree based on the DNA evidence

Notice the mention of Sophie Elisabethe Nicolai, daughter of Johann Georg Nicolai. Ernest spelled his last name exactly this way when he arrived in 1850. The DNA connection has been made. Although we do not have supporting documents, the most logical relationship between Ernest and Sophie would be brother/sister. At the very least, we now know the region of Germany (Thuringen) where Ernest lived, and we now have a likely father (Johann Georg Nicolai). We will leave additional analysis for another day. For now, we have to be pleased that so few DNA matches produced such big results.

Categories DNA

DNA of WAB, Pt 6: The Baker Subgroup

I have a particular fondness for the Baker subgroup. Harold had a sister, Ethel (Baker) Neff, who researched the family history and wrote “Historical Data, Anecdotes and Reminiscences” in 1949. It represented my start in genealogy. After the Revolutionary War, these ancestors left New England to settle newly opened lands in upstate New York. Unfortunately, records were hit and miss. While some of the inhabitants can be traced back into their early New England homes where the records can be quite good, others appear in New York out of thin air.

As we have done before, it is useful to look at the grandparents of Harold Baker as shown in the six generation tree with their associated color codes of navy (N) for Baker, blue (B) for male and pink (P) for female. These grandparents include Alden Dudley Baker (NBB), Eliza Blackmer (NBP), Robert Hill (NPB) and Augusta Wood (NPP). Maybe not surprising, but the two men have a more complete historical record than the two women. “Typical” results as my wife would describe them.

In terms of DNA, there is heavy reliance on ThruLines from ancestryDNA and cluster diagrams from Genetic Affairs. Both utilize the same shared matches to perform their magic. Since I have started these essays, there have been a few new developments. My aunt, initials of JD, sister of WAB, tested and allowed me to examine her results. Her ThruLines, which give subtly different results, were combined with WAB’s. Secondly, ancestryDNA no longer allows cluster analysis, so I am limited to analyzing her shared matches and ThruLines for now.

Harold Baker - Grandfather of WAB
Helen Hill - Mother of Harold
Everett Baker - Father of Harold
Ethel (Baker) Neff - Sister of Harold
Six Generation Family Tree for Harold Jay Baker

To the right is the Baker portion of the Genetic Affairs cluster diagram taken at 30 cM taken in Part 1. We see a nicely formed graph starting at Harold Baker (N) in the upper left, following by a cluster for Alden Baker (NBB) and Eliza Blackmer (NBP) and Eliza’s mother Marana Terry (NBPP). The mysterious red cluster labelled NNNN represents a whodat cryptocluster belonging to Elijah Knapp Fuller. He will be discussed later, but already we can tell that he connects to Marana Terry due to the gray dots. Missing are references to grandparents Robert Hill (NPB) and Adelia Wood (NPP).

If you have read the earlier essays, you will recognize that I take this Baker subgroup run at 30 cM, and use the extend-a-cluster technique of Genetic Affairs to create a Baker specific cluster analysis run down to 20 cM. I then try to incorporate the six generation tree for Harold Baker into the 20 cM analysis. Genetic Affairs has trouble with creating well formed clusters at this level. So, I use a modified version of the html file developed by my oh-so-helpful son to create reference clusters and to rearrange shared matches. Finally, I make my best guess for the common ancestor for each cluster. 

Closeup of the Baker Subgroup in WAB AutoCluster at 30 cM

Genetic Affairs of Baker Subgroup in Three Versions: Original, Modified with guide lines and Final Modified for a Clean View

DNA of Alden Dudley Baker (NBB)

Alden Dudley Baker

Ancestors of Alden Dudley Baker are well known and researched. Ethel Baker Neff knew Alden and talks about him in her memoir. She figured out that Peter Baker served in the Revolutionary War, and that William Baker first arrived in Concord MA from England around 1660. She also determined that Mary Palmer descends from Joseph Palmer by way of Puritan Walter Palmer of Stonington CT. I have extended the tree, showing, for example, that Joseph Palmer is descended from Mayflower Pilgrim John Howland. Not many shared matches cross the 20 cM threshold, which is typical of ancestors this far back. They can be found in Clusters 14 and 15. The ThruLines of all the families are shown, and all show matches to others that have been verified through traditional means. 

Seven ThruLines for Alden Dudley Branch of Baker Subgroup

DNA of Robert Lloyd Hill (NPB)

The Robert Hill branch can be found in cluster 13. We have a pretty good understanding of the branch. Ethel traced the Hill surname back to Thomas Hill who served in the Revolutionary War. Sylvia Frost can be found in a very useful New England book “The Frost family in England and America with special reference to Edmund Frost and some of his descendants” written in 1909.

My main contributions were the parents of  Thomas Hill and Mary Williams. They came from Pomfret in Western Connecticut which was quite remote prior to the Revolutionary War, and records there can be spotty. The genealogical proof for Isaac & Ruth (Squire) Hill and Stephen & Judith (Paine) Williams has never been great. Hope springs eternal that the DNA will support my conclusions.

The ThruLines reasonably support this branch. Most give multiple shared matches, specially on the Frost side. We see a single match for Isaac and Ruth (Squires) Hill – a small, but important, confirmation. However, the ThruLine for Stephen and Judith (Paine) Williams lacks any match. More research will be needed to determine if this ThruLine might be uncovering a problem where I assigned the wrong parents for Mary Williams.or

Seven ThruLines for Robert Lloyd Hill Branch of Baker Subgroup

DNA of Adelia A Wood (NPP)

Adelia Augusta Wood

Adelia Wood has always posed a research challenge. Her father, Stephen Wood, represented my first brick wall. Stephen and Hannah (Sprague) Wood eventually became my best guess for Stephen’s parents, with enough evidence to add their names to the tree, but without a lot of conviction. I had found better evidence for the ancestry of Deborah Knowles. Yet it still surprises me that she seems to have no connection to her New York home of Knowlesville. I learned that Deborah had three children through a first marriage to Elijah Avery before having an additional three children with Stephen. Clusters 16 and 17 are unassigned. One or both may be a good candidate to connect with Adelia.

When I look at the ThruLines of Stephen & Hannah Wood with their parents (David & Dorothy Wood and Elenezer & Hannah Sprague), I find common ancestors. While this result does not constitute proof, it is encouraging. I am more convinced than ever that the correct parents for Stephen Wood have been identified. The ThruLine results for Deborah, on the other hand, are decidedly weak. While I see one shared match for Thomas & Elizabeth (Walker) Knowles, there are no shared matches for Edward & Christian Knowles, Jonathan & Elizabeth Hathaway or any children from Adelia’s first marriage. So the DNA provides a reversal of fortunes. The DNA giveth and it taketh away.

Seven ThruLines for Adelia A Wood Branch of Baker Subgroup

DNA of Elizabeth Blackmer (NBP)

Now we come to Eliza Blackmer, the most interesting of the DNA results. Ethel knew so little about Eliza, she even misidentified Eliza’s parents in her genealogy. Some progress was made with the identification of Homer Blackmer and Marana Terry. Yet brick walls quickly emerged for Aurilla Limekins, Hiram Terry and Clarissa Searles. 

Despite this lack of knowledge, a massive NBP supercluster dominates the Genetic Affairs chart. I was further able to differentiate the NBP into subcategories on Marana Terry’s side, NBPP, with her parents Hiram Terry (NBPPB) and Clarissa Searles (NBPPP). We have seen large superclusters in both the Perkins and Woods families so no surprise here. Clusters 4, 6 and 8 are particularly large, and may be pseudoclusters as discussed in Part 2.

The Homer Blackmer (NBPB) side of the tree acts as expected. No reference matches for Nathaniel & Aurillia Blackmer and Soloman & Janet Blackmer are able to cross the 20 cM threshold. However, their ThruLines show plenty of shared marches under 20 cM. There is not yet enough detail to even speculate about Aurilla Limekins although clusters 1, 4 and 5offer a good starting point. 

Four ThruLines for Elizabeh Blackmer Branch of Baker Subgroup

It is the Marana Terry branch that stands out. Four shared match across the 20 cM threshold for a NBPP, and one shared march across the 20 cM for NBPPB (Hiram Terry). This later match is hard to see in the cluster diagram but it is important because it allows us to differentiate NBPPB’s from NBPPP’s, and identify pink cluster 8 as Hiram’s side. So let’s take a step back and examine the surviving record of Hiram Terry and Clarissa Searles to see what we can add to the tree.

Hiram Terry-Revolutionary War veteran from Berkshire County, Mass. Married Clarissa Searles; died 1837-1838, buried in Oakridge Cemetery, Lima. Moved to Livingston County about 1801. Children born: Hiram Terry, Jr., Henry Terry, Silas Terry, Zelphia-Zilpha Terry, John James Terry, Casina N.Terry. Reported to have fathered 22 children.

All of this information comes from one individual: a grand daughter of Zelpha who was trying to piece the story together back in the 1980’s. All trees, including mine, seem to reference her work. In my research, I have seen no record for Clarissa Searles. I have seen no evidence that Hiram fathered 22 children. This story may be anecdotal, meaning it may have grains of truth.  I do show using census records that the family moved from Berkshire county, MA to Livingston county, NY around 1800. Children of Hiram state via the 1880 census state that Hiram was born in MA or CT, and that Clarissa was born in VT or CT. I think I have identified seven children, nowhere near 22. The Trueline of Hiram and Clarissa only confirms two children so far. Finally, I found the gravestone for our Hiram (b. 1748, c. 1840) buried in Michigan with his son Hiram Jr.

AncestryDNA tries to offer suggestions based on the trees of other researchers who generated various birth and death dates. Take a look at the ThruLine for Ebenezer and Mary (Helme) Terry. Notice that Hiram is listed twice. Analysis of the genealogical record leads to the conclusion that Ebenezer and Mary had a son (b. 1737, d. 1782 ) and at least one grandson (b. 1763, d. 1802) named Hiram. Neither branch is correct since both died before Marana’s birth in 1806. Yet Ebenezer and Mary have three unique matches in the ThruLine who are likely common ancestors of WAB. My best guess without any proof is that our Hiram may be another grandson of Ebenezer and Mary. 

Elijah Knapp Fuller Sketch

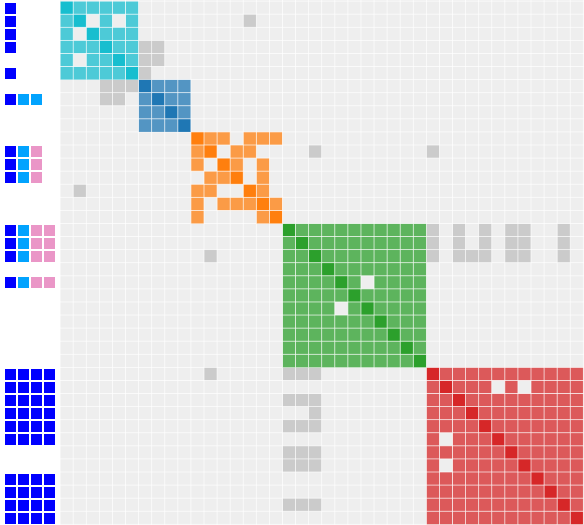
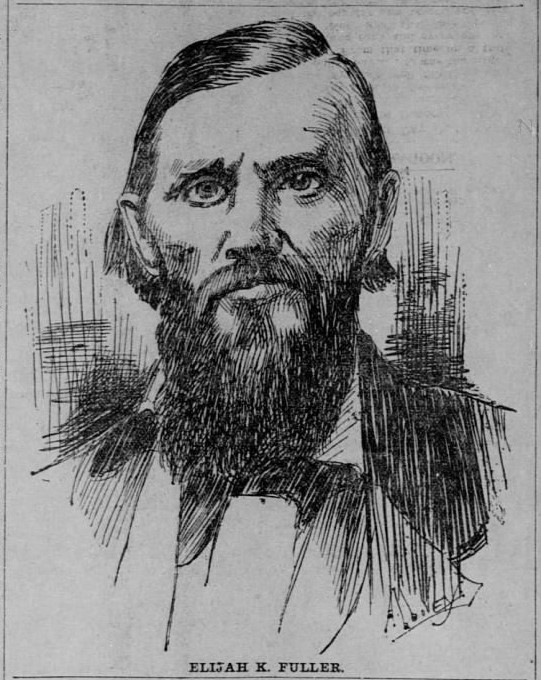
I have an admission to make. The NBPPP reference squares are mostly NNNN’s for my whodat cryptocluster, Elijah Knapp Fuller. You cannot distinguish the two, meaning that Clarissa Searles and Elijah are closely related. Elijah started his life in Greene County, NY, moved to Illinois, then Utah as an early member of the Church of Latter Day Saints. Married 6 times, with 33 children, Elijah’s DNA is bound to show up in a lot of ancestry samples. More importantly, the half siblings lived in a small community in Utah where multiple related marriages would be unavoidable. From a genealogical perspective, the shared DNA of these descendants gets magnified. Therefore, we see a lot of shared matches to WAB that are able to cross the 20 cM threshold.

Not all the trees in cluster 10 go back to Elijah. Some of these matches goes to Elijah’s parents, and one goes back to Elijah’s grandparents. Therefore, we have an explanation for the cryptocluster: Elijah is not the common ancestor. The common ancestor would be Elijah’ parents, grandparents or even great grandparents.

Clarissa Searles, if that is her correct name, must somehow be a Fuller. Her birth date must be estimated based on the census (b. 1761-1770 per the 1830 return). For better insight I constructed a TrueLine showing the Fuller family. Still not clear where she fits, but notice there are individuals named “Clarissa” and “Zilpha”. If I had to guess, I would put money on John Fuller and wife Dorcas Fuller (unrelated to each other) as the common ancestors. If this scenerio is true, then John and Dorcas would be a NBPPPB and NBPPPP. I tried forcing ancestryDNA to analyze this scenerio, but it does not run. Ancestry keeps including erroneous user submitted trees.

Conclusion

DNA results of the Baker subgroup have validity for the entire six generations associated with Harold Baker. That is back to the early 1700’s. We got some nice clues on the extending the tree with Hiram Terry and Stephen Wood, and we got warnings regarding the lineage of Deborah Knowles and Mary Williams. We also witnessed the effect that polygamy can have on shared DNA.  The DNA clearly strengthened our understanding of this line.

Categories DNA

DNA of WAB, Pt 5: The Perkins Subgroup

Jacob and Jennie (Jardine) Family Photo circa 1900: L-R Back Row Jennie, Fred, Herbert, Olive, Jacob, Charles Front Row: Edward

Four subgroups of DNA were created for WAB based on her four grandparents. Time to see what happens when we analyze the yellow coded Perkins subgroup – all the DNA associated with Olive Jean Perkins. As a start, here is the best guess six generation tree for Olive. For those counting, that’s an incredible eight generations from WAB. Let us again think grandparents with their respective color codes. This time it is Olive’s turn. All four grandparents landed in Ontario from various routes.

  • We have the Perkins wing, YBB, all of English, Puritan stock who became New England Planters (sometimes called “Preloyalists”) emigrating from New London county, Connecticut prior to the Revolutionary War. The exception are the Creelmans who left Ireland in the 1750’s. Everyone settled in Nova Scotia before moving west to Ontario.
  • The Vansickle subgroup, YBP,  represents the true Loyalists who moved to Ontario in the years after the War. Isaac and Jane Vansickle came from New Jersey. His family was of Dutch ancestry who arrived in NY around 1650.  The Zavitz family, Mennonite settlers in the early 1700’s, lived in Buck County, Pennsylvania. The War split the family with an entire branch leaving for Canada. Jacob and Katherine (Kayser) Minor emigrated in the 1740’s from Saxony, Germany, occupied towns in eastern Pennsylvania, and finally settled Ontario with their three sons.  I have admittedly neglected this YBP subgroup over the years. During the write-up, I discovered the zavitzfamily.org website which showed me an error in my tree. The correction, shown in the tree below, made the DNA results much more coherent.
  • John Jardine, YPB, a cabinet maker, likely arrived in Wentworth County, Ontario from Scotland in the early 1840’s with his wife and four children. Rachel was either his second or third wife. We know very little about him.
  • Rachel McKechnie, YPP, of Irish-Scottish descent, also arrived in the early 1840’s with her brothers. Although she managed to produce one child apiece from her two husbands, she was unlucky in love. Her first husband, whom she wed in 1844, died in 1846. In 1854, she married John, who promptly passed in 1855. No wonder she wears black in all her photos.
Six Generation Family Tree for Olive Jean Perkins

To analyze the data, I reviewed the 30 cM results uncovered in Pt. 1. Then I created a 20 cM genetic affairs chart using the extend-a-cluster technique described in Pt 2. This technique yielded 164 shared matches on ancestryDNA along with 19 clusters and 9 single matches using Genetic Affairs. Ironically, you can ignore all the pure Y’s (descendants of Jacob and Jennie). Y’s are technically associated with every square, so their presence in a given cluster doesn’t really mean anything, and tends to muddle the Genetic Affairs analysis. Also, keep in mind another strange factoid for this Perkins subgroup: there can YB’s but there will only be one pure YP. Jennie was an only child. In order to create another YP, you need a sibling of Jennie or a child of Jennie from another partner. Neither scenario exists, so Jennie Jardine will be the only YP.

I need to make one more disclaimer. This time about endogamy and pedigree collapse as I will use the terms going forward. Both represent “cousin love” as described in Pt. 2. To me, pedigree collapse happens over a few generations and can be hopefully viewed in the family tree as the number of ancestors collapses. Endogamy happens over a longer time as a population stays in a given area. Both have the same effect on clusters. They drive up the amount of shared matching between individuals and they create those gray dots in the cluster diagrams.

With those disclaimers out of the way, let us see what the 30 cM threshold data tells us.

  • We can see the division of the male (YBxxx) and female side (YPxxx) of Olive. Notice that the YB box contains a lot of gray squares suggestive of pedigree collapse or endogamy. Cluster 20, a cryptocluster, is likely connected to Olive’s father side due to the one gray dot. Note that this cluster was excluded due to lack of evidence at the time I did the 20 cM run.
  • Two grandparents show up at this level, but nothing further back in time: YBP in clusters 18 & 19 and YPB in clusters 14 & 17. YBB and YPP are still missing.
  • Genetic affairs does not do a very good job of arranging the cluster in the YB supercluster. Technically, the YB cluster should be located upper left followed by a separate YBP cluster. The presence of all the gray dots is likely confusing the algorithm, as is the presence of the pure Y shared matches.
All in all, very reasonable results. However, we want to push the limits of DNA testing, so it’s time to step down to the 20 cM threshold level.
 
Closeup of the Perkins Subgroup in WAB AutoCluster at 30 cM
WAB AutoCluster at 20 cM for the Perkins Subgroup

Olive’s Father (YB): Jacob Perkins
Everyone in cluster 1 is YB, having James and Mary (Vansickle) Perkins as common ancestors. If you look at the cluster chart, you can see that YB populates gray from clusters 2 through 14 which means that those clusters are related to Olive’s father’s side.

The picture at the right shows the family around 1870 (note that the photo has an error: Elijah who really “Eli” should be swapped with older brother Jacob). Susan in the middle of the photo had a large family so one should anticipate lots of descendants who tested. Mary Catherine is the little girl in the bottom right. Missing are descendants of Cyrus who settling in England. It’s only a matter of time before someone from this line tests with ancestryDNA.

So every DNA result perfectly matched WAB’s tree – except for one entry – the unexpected NPE . In this case, I uncovered a child born out of wedlock. So while the event happened over 100 years ago and the players have all passed, the offspring still carry a lot of matching DNA. While NPE’s can be difficult to unravel, the solution in this case proved to be quite easy because the birth certificate names the birth parents.

Probable Perkins family photo with mismarked names (l-r top): Jacob (age 18), Cyrus (19), (l-r middle): James (48), Susan(22), Mary(40), (l-r bottom): Eli(9), Mary(5)

It is instructive to compare my “TrueLine” above to ancestryDNA’s ThruLine for the same couple. Both have advantages. Although the TrueLine is more complete, the ThruLine identified additional shared matches that fall under the 20 cM threshold.

Descendants of James and Mary Perkins - TrueLine and ThruLine Versions (click image to zoom. Use arrows to scroll through images)

Olive’s Paternal Grandmother (YBP): Mary Vansickle
This supercluster, likely composed of clusters 3 to 15, connects to Olive’s paternal grandmother, Mary Vansickle, and her ancestors. Notice the large number of distant relatives (5th & even 6th cousins) which normally are not able to cross the 20 cM threshold. There were also a large number of unidentified shared matches. I would argue that this number of shared match above 20 cM is impossibly large and that other forces must be at work.

Let us start with a new wrinkle in the DNA sharing game. Mary Vansickle had a special relative, Ann Minor, who turns out to be a “double cousin” (they are cousins through both grandparents). This relationship differs from pedigree collapse because the pedigree does not get collapsed for either party. However, descendants will show an increased amount of shared DNA. TC in cluster 10 descends from Ann Minor. TC completely destroys my coloring code scheme since he is both YBPP and YBPB. However, TC shares a comparatively small 21 cM over one segment . I do not believe that this relationship has much impact on the size of the supercluster.

Most of the identified shared match of distant relatives are YBPPB (common ancestors of Jacob and Katherine Minor) and YBPPP (common ancestors of Jacob & Magdeline Zavitz). Most are found in clusters 4, 5, 6, and 7 but also scattered elsewhere. These shared matches also have the distinctive gray dots. When the Loyalists settled in Ontario, several generations of intermarriage occurred, particularly in the Zavitz and Minor families. The message from the lead historian of the Zavitz family site talks about his own lineage: “I am descended from 2 of Mary Zavitz’s brothers (Henry [Dad], Jacob [Mom]) and am related through a lot of other lines as well.” We have a classic case of pedigree collapse at work here, which magnifies the shared matches beyond the predicted amount and creates the gray dots.

However, many of the clusters appear to be pseudoclusters with parasite shared matches attached to a legitimate match, which is indicative of pile up (see Pt 2 for a better description). Clusters 8 and 12 stand out due to their large size, but others, such as clusters 3, 14, 15, could also be included. These parasitic shared matches make it difficult for Genetic Affairs to arrange the clusters accurately. Remember that YPB should be in the upper left, followed by distinctive YPBP, YPBB clusters etc.

The fact that we see both endogamy (lots of gray dots) and pile up (shared matches with no connection to the tree) in the same YPB supercluster and all above the 20 cM threshold would seem to be more than coincidence. So maybe my understanding of the DNA needs more refinement. Nevertheless, YPB dominates the Genetic Affairs cluster diagram, which is confirmed by the large number of matches seen the various YPB ThruLines shown below. A lot of shared matches exist for this line, even if I do not think they are all real.

Speaking of ThruLines, the output generated for Jacob and Magdalene Zavitz shows why I have a healthy distrust of ThruLines. According to this chart, our ancestor Mary Zavitz is both sister and daughter to Henry Zavitz (there is an obvious reference here to the movie, “Chinatown”). This error occurs because ancestryDNA employs user submitted trees that claim erroneously that Mary is Henry’s daughter. We made this error because somebody in the past made this error, and we all copied it. So I correct the mistake, but ancestryDNA cannot handle the truth.

ThruLines for Six Families in the Mary Vansickle Branch (click image to zoom. Use arrows to scroll through images)

Olive’s Maternal Grandfather (YPB): John Jardine
Clusters 16, 17 and 18 all relate to Olive’s maternal grandfather, John Jardine. As mentioned, John Jardine was married prior to his arrival to Ontario. The TrueLine below shows descendants of these two marriages who have had their DNA tested.

TrueLine showing descendants of John Jardine who tested

Now, one of trees of a shared matches in cluster 16 did not lead to John Jardine, but rather to a Margaret Jardine. Like John, she moved to Canada from Scotland after her marriage to Hugh Campbell. I rearranged WAB’s ancestryDNA tree assuming Margaret is John’s sister to test this hypothesis. The resulting ThruLine supports this assumption. Turns out that Margaret and John can be found in the same marriage register when they both wed in Greenock, Scotland, a little northwest from Glasgow.  Based on this DNA result and this extra traditional evidence, I feel confident adding Margaret (Jardine) Campbell to the family tree. So while we still do not know the parents of John and Margaret, we have expanded the family and have learned the location of their home in Scotland.

Using ThruLines to test Hypothesis that John Jardine had a sister Margaret

Olive’s Paternal Grandfather (YBB): James Perkins
A single cluster, 19, refers back to Olive’s paternal grandfather (YBB), James Perkins. This match to user junedanaher42 is YBBPP,  corresponding to Harriet Turner, making the common ancestors Thomas and Hannah (Witter) Turner. This does not seem to make much sense. Where are the YBB’s, YBBB’s or the YBBP’s who are more closely related? To examine that question, look at ThruLines for each these missing matches.

Neither ThruLines nor Genetics Affairs identified a YBB, a descendant of William & Harriet (Creelman) Perkins. I looked everywhere even combing through ancestryDNA trees. Likely no one has tested yet, but I will remain about concerned about a NPE until I find someone. Fortunately, both YBBB and YBBP show shared matches with ThruLines with some matches exceeds my magical 20 cM threshold. Genetic affairs missed the 25 cM user janiceann11 who shares DNA with junedanaher42. ThruLines also identified a 20 cm user EM, who has no shared matches.

The Preloyalists moved an entire community to Nova Scotia. This large number of about 5000 settlers allowed the Perkins line to avoid intermarriage, keeping the level of shared matches low. However, intermarriage did occur. William Francis Perkins and Harriet Creelman are, in fact, related. In addition, there are several documented cases of marriage between the Perkins and Ely families during their time in New London county. The effect of these unions may have given junedanher42, janiceann11 and EM a little DNA shared match boost to carry them past the 20 cM threshold. Otherwise, any pedigree collapse here has little effect on this branch compared to the Vansickles.

Perkins Branch (YBB) Related Photos and ThruLines (click image to zoom. Use arrows to scroll through images)

Olive’s Maternal Grandmother (YPP): Rachel McKechnie
Only one single match was identified that can be traced to Olive’s grandmother, Rachel McKechnie (YPP). The match comes from the aptly named S McKechnie who shares 28 cM.

Below is a ThruLines representation for Rachel and her siblings. This chart looks quite accurate since Robert, Stephen, John and Jessie are all documented siblings of Rachel. Note that BR had a match of 28 cM but she does not share DNA with anyone else. None of the other matches has a guess about parents of either John McKechnie or Mary Gray. No shared matches suggest an avenue to explore. So, unfortunately, we continue to hit our heads against the proverbial brick wall.

The photo to the right shows Rachel with 3 of her brothers: John, Thomas and Stephen. I think that this photo also has a error. According to my research, Thomas (born 1822) died Illinois in 1872 at the age of 49. The guy in the upper right is more likely Robert born in 1807. He looks like the oldest, and the four people in the photo all lived in Canada.

McKechnie Family Photo
ThruLine for John and Mary (Gray) McKechnie

Cluster 2
We finish off with a great little whodat cryptocluster. The common ancestors in cluster 2 would seem to be Benjamin Elijah “Lidge” Tucker b. 1849 in Arkansas died 1918 and Mary Malinda Chastien b. 1847 in Kentucky. They married in 1872 in Arkansas. How does the Perkins DNA get from Canada to Arkansas in mid 1870? Good question. The cluster shares gray with cluster YB but shares no gray with the rest of the chart which is almost all YBPx. Therefore cluster 2 most likely points to a YBB. These observations will only go so far. YBB could point to James Perkins, but equally to his brother William or sisters Harriet or Sarah. Children of these siblings are also YBB. So you still need to connect dots between Arkansas and Ontario through classical genealogical research.

Conclusion
I admit it. For years, I have focused attention on the Perkins surname at the expense of the others in this yellow subgroup. Cluster analysis forces one to consider all sources of DNA equally. In this case, we see the Vansickle line dominate. Cluster analysis has also opened up new areas for exploration. There is cryptocluster 20 in the 30 cM chart and cryptocluster 2 at 20 cM, among others. Now that we know where the brick walls are located, it would also be nice to drill down a little further, say 12-15 cM threshold, to look for additional clues in the Jardine and McKechnie branches. At that level, maybe I might even uncover additional matches in my favorite stomping ground of the Perkins line.

Categories DNA

DNA of WAB, Pt 4: The 20 cM Problem

The last essay (DNA of WAB: Understanding the Gray)  tried to explain the gray dots in the Genetic Affairs results at 20 cM on the Perkins subgroup. I concluded that the gray was a not necessarily a sign of endogamy or pedigree collapse, but should be embraced as a feature of an “ideal” tree. There is another aspect of low threshold cluster diagrams that needs to be discussed. Genetic Affairs has increased difficulty sorting the clusters as the minimum threshold drops from 30 to 20 cM. So in this essay, I want to describe the general problem at 20 cM and propose a solution. A more detailed discussion of the Woods family will wait for a future essay.

The process for creating the Woods results is similar to before. The six generation tree for Helen Woods is shown below, along with the portion of the 30 cM WAB Genetic Affairs cluster diagram that shows the Woods subgroup. The extend-a-cluster technique was utilized to create a 20 cM Woods cluster diagram. I then looked through all the shared matches to find as many common ancestors as possible, and added them to the diagram using the Red(R), Blue (B) and Pink (P) coding scheme.

Six Generation Family Tree for Helen Josephine Woods
Initial WAB AutoCluster at 20 cM for the Woods Subgroup

How do you make sense of the cluster diagram?
The cluster diagram clearly shows the differentiation between Helen’s father and mother, who are a RB and RP respectively. However, her father’s side, which dominates the diagram, is hopelessly mixed. Look how the shared matches with common ancestor RB get scattered across clusters 1, 2, 4, 5, 6 and 9. Fortunately, I can reapply my son’s algorithm to this plot and reassign the known shared matches. Here is the technique:

  • First, all the RP’s were turned off, because I need to focus on the RB results
  • The known tree results are put into unique clusters in the upper left corner. This created six reference clusters.
  • The remaining shared matches were kept in their previous clusters. Clusters 5 and 10 disappeared because they landed in the reference clusters.
  • By looking at the distributions of the gray dots, patterns emerged showing that certain clusters should be lumped together into superclusters.
    • Cluster 6 shares matches with reference RB and has one shared match with RBB. I am calling it a RB, where that first shared match should probably be moved to RBB. Or this whole cluster could be a RBB (there is a lot of art to this science).
    • Clusters 1, 4, 12 and 14 share matches with references RB and RBB. I am calling this supercluster a RBB
    • Cluster 13 shares matches with references RBB and RBBB, which would make it a RBBB.
    • Clusters 3, 7 and 8 share gray with references RB, RBP and RBPB making it a RBPB.
    • Clusters 2, 7 and 11 all share with references RB, RPB and RBPPB, making this supercluster a RBPPB.
    • All grays dots are explained by a normal tree except for the outliers noted below. Outlier 1 is a RBB-RBPB. Outliers 2 and 3 are RBB-RBPPB, and outliers in 4 are RBPB-RBPPB. The last group is perhaps the most interesting because they suggest the endogamy or pedigree collapse needed to raise the shared match level high enough to exceed 20 cM for very distant relatives.
Modified WAB AutoCluster at 20 cM for the Woods Subgroup - With Guide Lines

Congratulations if you have followed along this far. It is a little convoluted, but it is the only way I can make sense of the clusters generated by Genetic Affairs at this 20 cM level. Now, for example, I can focus my attention on the RBB supercluster in search of shared descendants to Mollie Laird who was a RBBP. Look below to see a clean version of the chart above without the guide lines.

What is going on here?
In a previous life, I did some engineering, and this result seems like a classic “signal to noise” problem. It’s similar to listening to music on an airplane. To hear the song, you either need a lot of signal (crank the volume), eliminate the noise source (however, turning off the engines is a very bad idea) or add a filter to lessen the noise relative to the signal (think noise cancelling headphones). In our case, the signal is going down because the threshold is decreasing, and the collection of shared matches is kind of noisy. RBB and RBPPB appear to me to contain those nasty pseudoclusters that do not lead anywhere. They act as the genealogical equivalent to noise. As a result, the Genetic Affairs algorithm starts to struggle. However, all is not lost. The reference clusters acts as the filter to help separate from real matches from the noise.

Modified WAB AutoCluster at 20 cM for the Woods Subgroup - The Clean Version

What’s next?
A lot of the problem stems from the way that ancestryDNA establishes a shared match. It seems to create these annoying pseudoclusters. Since I cannot use a chromosome map to study them, I need to find a way to identify them and filter them out. Next, it would be nice to use the extend-a-cluster technique in specific regions under the 20 cM limit. Some regions seem to be more free from pseudoclusters than others. Finally, and most importantly, I need to show that the modified graph was worth the time to create it by adding meaningful results to the tree.

Categories DNA

DNA of WAB, Pt 3: Understanding the Gray

This post represents a little aside in seeking to interpret the family subgroups generated by Genetic Affairs. In particular, I want to understand the nature of the gray dots. So let’s go ahead to the cluster diagrams of the Perkins subgroup so we can better understand the results when we talk about the Perkins family at a later time. We need to tree to start, so below is a six generation family tree for WAB materal grandmother, Olive Perkins.

Six Generation Family Tree for Olive Jean Perkins

To analyze the data, I reviewed the 30 cM results uncovered in Pt. 1. Then I created a 20 cM genetic affairs chart using the extend-a-cluster technique described in Pt 2. This technique yielded 164 shared matches on ancestryDNA along with 19 clusters and 9 single matches using Genetic Affairs. Ironically, you can ignore all the pure Y’s (descendants of Jacob and Jennie). Y’s are technically associated with every square, so their presence in a given cluster doesn’t really mean anything, and tends to muddle the Genetic Affairs analysis. 

WAB AutoCluster at 20 cM for the Perkins Subgroup

Genetic Affairs did a very good job of organizing the clusters but it did experience some difficulties. For example, note that YBP is found in both clusters 8 and 12. It is worth noting that both of these clusters appear to have extraneous parasitic shared matches. Since I have the added knowledge of the tree, I wondered what would happen if I reordered based on the known matches. Many thanks to my trusty son who wrote a routine to reorganize the clusters in Genetic Affairs. This routine allows me to turns off dead-end matches, and to reassign a match from one cluster to another. You can edit these features yourself if you launch the link below and go to the section entitled, “AutoCluster Cluster Information”.  Click on the cluster number of change the assigned cluster of a given shared match. Use the check box to turn on/off a particular shared match. Then hit the “Update Cluster Chart” button.

Using the routine, I was able to generate the modified cluster diagram to the right. Note a large number of gray dots. In part 3, I speculated that this gray was due to endogamy or pedigree collapse (take your pick). However, that concept needs to be revisited. It turns out that gray will occur “naturally”. 

To see this phenomenon, I created a idealized version of a pedigree chart for Genetic Affairs assuming no endogamy, no pedigree collapse, and no minimum threshold. Here are the characteristics:

  • The size of the clusters will  increase with each generation because the number of descendants increases
  • The level of shared match will go down with each generation because the DNA is diluted. This is illustrates using lighter sides of purple in the diagonal.
  • Regions with gray dots will exist. Violet (V) will be found in every descendant because they all have V in them. Violet-Blue will be found in every descendant that starts with VB. VBP (P=pink) will be found in very descendant that starts with VBP. And so on.
Modified Cluster Chart based on WAB's tree
Idealized 4 Generation Cluster Diagram

Now time to revisit the gray in terms of regions labelled A through D

  • A: YB shows gray sharing with YBP, YBPPP and YBPPB
  • B: YBP shows gray sharing with  YBPP and YBPPB
  • C: YBPP shows  gray sharing with YBPPP and YBPPB
  • D. YBPPB shows gray sharing with YBPPP

Regions A through C are fully expected since they show DNA being passed “normally” with no need to introduce endogamy or pedigree collapse as shown in the idealized chart above. Only the single gray dot in region D is unexplained since YBPPB should not expect to share a match with YBPPP.

Although the modified cluster diagram actually shows a normal genealogically response with little endogamy, questions remain in the original cluster chart.  I still don’t know why YBPxx has such a high amount of shared matches, although, it should be noted that this level is an indicator of endogamy. Finally, I still don’t fully understand those parasitic shared matches concentrated in clusters 8 and 12.
 
Maybe, I will learn  more when I examine the Woods and Baker subgroups.
Categories DNA

DNA of WAB, Pt 2: Needles in Haystacks

Part 1 introduced the Genetic Affairs program which organizes the various ancestors by creating clusters of DNA shared with WAB. As mentioned, any shared match above 30 cM suggests a likely genealogical match. By the end of the article, clusters 20, 21 and 22 remained unidentified, and there were a series of nine results with > 30 cM that have only one match (making them a lonely cluster of one). Now comes the slow process of examining each of these twelve clusters one-by-one. The hope is to understand each one, and identify its place in the tree, with emphasis on uncovering the Nicklos subgroup, consisting of Ernest Nicholas, Charlotte Zieryacks, James McDowell of Scotland (not to be confused with James McDowell of Pennsylvania in the Woods line) and Isabella McLeod.

WAB's Six Generation Family Tree

There are a lot of different ways to investigate each cluster. Some people have elaborate trees that we can examine for possible matches. Others have snippets of a tree which we can expand by building “quick and dirty” trees. We can look for additional shared matches of a 30 cM individual down to 20 cM. It’s important to include the geographic clues since we know where WAB’s ancestors lived and when they lived there. We can write messages to the individuals to see if they want to collaborate, although the response rate is frustratingly low. Ultimately, we need a matching family tree that intersects WAB’s.

Extend-a-group
Here’s a nice trick to allow analysis of a subgroup. AncestryDNA allows us to assign shared matches to one or more custom groups. So I converted the Woods, Baker and Perkins subgroups into ancestryDNA custom groups. Genetic Affairs can be configured to run these custom groups. Furthermore, we can set it to extend the group to look for all shared match to a lower threshold (hence, my pet name of “extend-a-group”). When I use this technique for the Baker subgroup of 41 matches, I get a list of around 200 shared Baker related matches down to 20 cM. Then I go back to Ancestry, and assign these 200 to a new group called “Baker to 20 cM”. It takes a little bit of art to massage this list. Matches that are too closely related might be removed. Matches that Genetic Affairs missed might get added. Then I run Genetic affairs again  (with extend feature unchecked). Viola! We have a cluster diagram for our deep dive in the Baker, Perkins or Woods lines.

AncestryDNA custom groups created for WAB

The Cryptocluster and the Pseudocluster
Despite all these efforts some clusters remain unidentified. These clusters contain a lot of shared DNA and robust trees, but with no connection found to WAB. I am going to coin the term “cryptocluster” because of the way these clusters hold their secrets. Cryptoclusters might be legitimate or they might be fake earning them my derisive term “pseudocluster”. I don’t like pseudoclusters because they do not lead to a common ancestor, yet they suck up a lot of research time. Currently, I can think of five reasons why a cluster remains a mystery: 

  • Potential Causes of Legit Cryptoclusters
    • I am wrong – The result points to an erroneous or unknown branch with my tree, possibly due to a NPE (see below)
    • They are wrong – Other members of the cluster may be presenting inaccurate information
    • Everyone is wrong – The underlying genealogical record is faulty.
    • Endogamy – Marriage of somewhat related individuals (see below)
  • Potential Causes of Pseudoclusters
    • A false positive – The result in an individual match is wrong due to random variation
    • Pile up – The result of a group of matches is wrong due to a systemic issue in the DNA (see below)
    • A faulty computer algorithm – Genetic Affairs or Ancestry has created a cluster in error

The Nonpaternity Event (NPE)
Sometimes a cryptocluster points to a completely unexpected direction: the surprise DNA result. Genealogists have dubbed these discoveries as nonpaternity events (NPE’s). It’s such a nondescript term. I have heard many NPEs better described as “shenanigans”. Because they occur for a variety of reasons (adoption, out-of-wedlock births, etc), the surprise unmasks a messy side to DNA testing. Without getting into an ethical argument of uncovering these family secrets, it should be noted that it can be very difficult to prove the results with certainty because the supporting genealogy evidence has been swept under the family rug. WAB’s DNA has uncovered a few NPE’s, all over 100 years old. Fortunately, the major branches of the tree has survived intact (so far). If the amount of shared DNA is high enough, I can usually figure what likely happened. However, if the event happened too long ago, then the amount of shared DNA will get too low to unravel the story. The surprise result will remain a cryptocluster.

I have identified a special subset of cryptocluster. The sequence NNNN in cluster 13 of the Genetic Affairs chart points a guy named Elijah Fuller Knapp. Who is that?, or as a Louisiana Cajun might ask, whodat? While he could be a NPE, other possibilities exist. For the time being, cluster 13 is a whodat cryptocluster.

Endogamy
Think of endogamy as “cousin love”. Not the first cousin stereotype. Instead, consider second cousins, third cousins, second half cousins, etc. Let us say you live in a small, isolated community and you want to marry someone who shares your interests, values and culture. That special someone could also easily share a recent common ancestor. The effect on DNA results can be profound. You can see it in the cluster results in two significant ways. First, you will see high levels of shared matches in endogamous results, since shared DNA comes from multiples sources. A 30 cM match from a endogamous branch appears to be more closely related than it is. Stated another way, endogamy acts as a shared match magnifier. Second, you will see a whole bunch of the gray dots in Genetic Affairs since there are multiple common ancestors in a given cluster. Look no further than my father’s side if you want an extreme example of endogamy.  Clusters 1 to 21 map the DNA of my paternal grandfather, born of Ashkenasi Jewish parents, a classic endogamous population. You have to look hard to find cluster 22 representing the DNA of my paternal grandmother. “Cluster Bomb” would seem the appropriate term.

Since WAB’s grandparents arrived from such different geographic locales, much of WAB’s tree would seem devoid of endogamy. Or is it? Take a look at all the gray inside the boxes of the Woods, Baker and Perkins subgroups.

Pile Up
Sometimes sharing is detected among an impossibly high number of relations. If you look at the genomes on the chromosomes, particular regions appear to “pile up”. From my limited scope of understanding, everybody has unique areas of pile up on their DNA genome. You really need a chromosome map to identify them.  Unfortunately, we are limited to ancestryDNA’s view of the world. AncestryDNA knows about pile up, and its algorithm tries to exclude known problematic regions when it determines shared matches. To me, the odds are low that this algorithm is 100% effective in weeding out pile up.  

Confidence ScoreApproximate amount of shared cM'sLikelihood of a single recent common ancestor
Extremely high> 60 cMsVirtually 100%
Very High45 - 60 cMsAbout 99%
High30 - 45 cMsAbout 95%
Good16 - 30 cMsAbout 50%
Moderate6 - 16 cMs15 - 50%

Now, let us revisit the ancestryDNA odds table where it states “the likelihood of a single recent common ancestor” is 50% for a 16-30 cM match. Normally, we think that these odds apply to a shared match of one person to another. Pile up suggests that these odds are not necessarily random. Instead, shared match errors may be correlated (the same error happens repeatedly in a given group). As a result, the confidence score could apply to a whole cluster, or part of a cluster. I have tried to use 20 cM as a cutoff to avoid pile up or any other cause of a pseudocluster, but it may not be good enough. If the error is so correlated, then it might be that 50% of entire clusters are pseudoclusters when Genetic Affairs is run at the lower 20 cM threshold.

What does a pile up look like? Rick Marshall, writing in the Genetic Affairs User Group, used chromosome maps to identify a pile up region in his DNA. He then showed the results on Genetic Affairs. I have seen similar results in my cluster diagrams as illustrated below. Whereas we can think of endogamy as a shared match magnifier, pile up acts as a shared match parasite. Here are the notable characteristics:

  1. The cluster is really big compared to the clusters around it. DNA is piling up.
  2. The cluster may contain a few legitimate matches in the upper left corner representing the legit host cluster. Those matches have the highest amount of shared DNA. The rest of the cluster is the parasitic pile up DNA latching onto the host.
  3. You wouldn’t find any common ancestors, because none exist.
  4. Because it has no matches, the pile up region has few grays dots.
Example showing likely Endogamy
Example of likely Pile Up in Olive Perkins Cluster

Many of the comments above are observational with a dash of pure science to give me cover. More observations and testing will be necessary to understand the cluster charts at lower thresholds. You have to be flexible in this analysis since new tools, techniques and people get added all the time. Recently, a new single match has surfaced. As you will see, single match 10 has proven to be extremely important.

Cluster 20: This cluster was omitted from the Perkins subgroup despite a single gray dot that intersects. So the extend-a-cluster technique was run without this cluster. Now, when I compare my results to the Perkins at the 20 cM threshold, I see 4-5 shared matches – all to the Perkins subgroup. Cluster 20 has become a cryptocluster within the Perkins subgroup.

Cluster 20 Results

Cluster 20 Match Name at 30 cMShared Matches at 20 cMMatchFound on a Extend-a-cluster list?
Erica Plyler51.1Perkins
William Manuel
30.3Perkins
Esther Cameron24.1Perkins
Michael Johnson24.3Perkins
vickimagee_120.2Perkins
H.C. by aiuzzolino140.1
Esther Cameron24.1Perkins
Michael Johnson24.3Perkins
vickimagee_124.3Perkins
Todd Rank40.1
Ester Cameron24.1Perkins
Jane Westergaard-Nimocks24.3Perkins
Nicky_C37.1
Esther Cameron24.1Perkins
Michael Johnson24.3Perkins
vickimagee_120.2Perkins
T.U. by Mary Lou Upton33.1Not Found
Lacy Ayers33.3Not Found
Peyton Gifford32.1Not Found
jdliz8232.1Not Found
James Blake31.1Not Found
Jane Westergaard-NimocksPerkins
Nancy French31.1
Esther CameronPerkins
Muriel Bissell30.2
Esther CameronPerkins

Cluster 21: Four people in the cluster, two with trees and no obvious overlap with WAB tree. Many people in the trees have upstate New York connections, which might suggest a Baker connection, but nothing yet. No connection to DNA of Baker, Perkins or Woods subgroups down to 20 cM. 

Cluster 21 Results

Match NameShared Match to 20 cMLength of MatchComments
Barbara Mellor
43.2No
C.S by Alisa Mayer38.2
ginapayne76138.2
nancyandnelly35.1
Gayle Lauriano27.2
C.S. by Alisa Mayer38.2Click here for tree.
Barbara Mellor43.2
ginapayne76138.2
JohnPeper25.1
Amanda Fletcher23.1
Gordon Ellis23.1
Deborah Ellis22.1
William Fletcher21.1
ginapayne76138 cM / 2 segsClick here for tree.
Barbara Mellor43.2
C.S by Alisa Mayer38.2
nancyandnelly35.1
JohnPeper25.1
Amanda Fletcher23.1
RSmaldon23.1
William Fletcher21.1
Timothy Hampton21.2
nancyandnelly35 cm / 1 segNo
Barbara Mellor43.2
ginapayne76138.2

Cluster 22: Very interesting cluster. There should be an obvious relation because the top match, LC, shares an impressive 77 cM of DNA. He also has posted an well-researched tree to cross-reference. Unfortunately, no common ancestor here. The second member of the cluster, EW, shares 58 cM, but has no tree available. I was, however, able to create a tree for another shared match of 29 cM, JJ. Again, no common ancestor. However, JJ has one ancestor named Elsie Slotz who was born Dec 1873 in Saxony Germany. So I wandering if she might be related to our Ernest Nicholas line who also came from Saxony. Much more work to do on this one.

Cluster 22 Results

30 cM Match NameShared Name to 20 cMLength of MatchComments
LC
77.6Click for tree
EW58.4
JJ29.3Click for tree
EW58.4No
LC77.6

Single Match 1: G.G. managed by mgilbreth62 (53 cM / 2 segs)
G.G. shares 53 cM of DNA with WAB. Based on mgilbreth62’s snippet of the family tree, GG is son of Beatrice I (Goodridge) Gilbreth born near Rochester, NY. Breatrice was also part of my Casa de Schwartz tree, making our common ancestors, Stephen and Sylvia (Frost) Hill. WAB and GG are likely 4th cousins.

Single Match: G.G. managed by mgilbreth62

Single Match NameShared Match to 20 cMLength of MatchComments
G.G. by mgilbreth62
53 cM / 2 segsYes. Click here.
Leslie NothamCommon Ancestor: Stephen & Sylvia (Frost) Hill.
Makenna Adams
L.F. by 1_rafstamps

Single Match 2: Loretta Penning (49 cM / 4 segs)
Loretta does not have a usable tree, but she does have two shared matches, both of whom are clearly associated with the Woods family line. So Loretta’s DNA match will be thrown into the “Woods down to 30 cM” pot for further ananlysis.

Single Match: Loretta Penning

30 cM Match Name NameShared Match to 20 cMLength of MatchComments
Loretta Penning
49.4Tree unusable
C.V by PeggyADK218.12Common ancestor is William Woods & Mary Laird
D.F. by jkfulk161923.1
Mike Fulkerson22.2
dtarango120.2Common ancestor is Patrick McLaughlin & Elizabeth Smail

Single Match 3: Craig Terkelsen (40 cM / 4 segs)
Some hope for this match. This group may provide a link to the McDowell family who married in the the Nicklos line. See “Elizabeth McDowell” born 1835 in Ayr Scotland in the tree of DarthTorment

Single Match: Craig Terkelsen

Shared Match NameLength of MatchComments
DarthTorment 22.2Click to see tree
G.N. by deborah mccray21.1No Tree
Craig Campbell21.1No Tree

Single Match 4: Connie Peabody (38 cM / 2 segs)
Connie’s has a tree and it does not intersect with WAB’s. However, one of the shared matches has a common relation of Homer and Marana (Terry) Blackmer, making it likely to be part of the the Baker subgroup

Single Match: Connie Peabody

Match NameShared Matches to 20 cMMatchComments
Connie Peabody38.2Click here to see tree.
krichmond196337.3Common ancestor, Homer & Marana (Terry) Blackmer. Click here see.
Russell Finch29.1
Elizabeth Reedy28.2Tree unusable.

Single Match 5: W.W. managed by Patty Bueker (37 cM / 3 segs)
No tree for WW. No connection yet. Seven shared matches at 20 cM / 1 segment level, suggesting that these members may be part of a pile up region.

Single Match: W.W. managed by Patty Bueker

Match NameShared Match to 20 cMMatchComments
W.W. managed by Patty Bueker
37.3No
F.C. by Beverly Linquist24.1Click here to see tree.
M.M. by mmandbs20.1
G.D. by Kathryn Frasier20.1
Richard Deese by sideese904720.1
Eric Oden20.1
Amanda Roth20.1
C.H. by Genealellie20.1Private Tree
S.W. by Genealellie20.1Private Tree

Single Match 6: P.H. managed by Aggie Henry (35 cM / 2 segs)
Shared matches down to 20 cM share DNA with the Perkins subgroup. The trees of several of the individual intersect the Jacob and Katherine Minor.

Single Match: P.H. managed by Aggie Henry

Match NameShared Matches down to 20 cM Length of MatchComments
P.H. managed by Aggie Henry
35.2No Tree
Stacey Brown31.1
barryandrobin_129.3shares DNA with Perkins subgroup
sandylefebvre by Julie Lefebvre27.2shares DNA with Perkins subgroup
jlefebvre163 by Julie Lefebvre27.2shares DNA with Perkins subgroup
bonjohnpc23.2common ancestor Jacob & Katherine Minor
M.G. by jmhird122.1common ancestor Jacob & Katherine Minor
Bill Daniels21.1shares DNA with Perkins subgroup
jennifer kilty21.1shares DNA with Perkins subgroup
lindaberry44120.1common ancestor Jacob & Katherine Minor

Single Match 7: Miriam Mathews (34 cM / 2 segs)
All matches shared common ancestor of John & Agnes (Lossee) McLaughlin, making it a connection to the Woods subgroup.

Single Match: Miriam Mathews

Match NameLength of MatchTree?
Miriam Mathews34.2Common ancestor: John & Agnes McLaughlin. Click here to see.
C.V. by PeggyADK218.12Common ancestor: William Woods & Mary Laird
C.D. by PeggyADK49.7Common ancestor is William Woods & Mary Laird
cydemmons25.7Common ancestor is John & Agnes McLaughlin

Single Match 8: ScotterMac (32 cM / 2 segs)
This cluster needs more work. No connection to DNA of Baker, Perkins or Woods subgroups down to 20 cM. Only a single tree with no overlap to WAB’s tree.

Single Match: ScotterMac

Match NameShared Matches to 20 cMLength of MatchComments
ScotterMac34 cM / 2 segsTree Unusable
Susan E Acevedo29.2Click to see tree
km3949729.3Private Tree
D.C. by alefteye24.2No Tree

Single Match 9: Lisa Rusyn (31 cM / 2 segs)
Lisa shares 31 cM and has a tree also. Various ancestors connected to Pennsylvania, Ontario and upstate New York. Unfortunately, the connection remains elusive

Single Match: Lisa Rusyn

Match NameShared Matches to 20 cMMatchTree?
Lisa Rusyn31.2Yes. Click here.
Danielle Greene29.2
Olivia Austin28.2
Bob Rudesill28.1
T.S. by Katherine Manolakas26.2

Single Match 10: Joan Lankton (97 cM / 4 segs)
Better to be lucky than good. Joan has a shared match to DarthTorment of Single Match 3. She also has a shared match with JL who can be found on WAB’s family tree. Therefore single matches 3 and 10 connect to the McDowell line in the Nicklos subgroup.

Single Match: Joan Lankton

Match NameLength of Match (cM)Useful Tree?
WABJDJN
JL2311772Yes
JLankton9721107Yes
SLanktonNone1223Yes
libertyandersonsweeny251926No
DarthTorment22None27Yes
bsinc2041520NoneYes

Conclusion
It looks like we succeeded in our goal to identify possible individuals associated with WAB’s Nicklos branch with cluster 22 and single matches 3 & 10. The cluster chart below was updated to reflect our new understanding of WAB’s DNA. There remains some unanswered matches that may yield still yield some surprises (Cluster 21 and four single matches). Despite all the talk of pseudoclusters, these results at 30 cM should have a legit cryptocluster answers. This page will be updated as progress gets made. 

Categories DNA

DNA of WAB, Pt 1: Introduction

DNA results for my mother are in, so now it’s time to analyze the data. The goal is to validate and extend the lineage for that side of the family. So let’s start with the family tree, and show all the people who contributed their DNA to Mom, listed by her initals, WAB, in an attempt to preserve some small level of internet privacy. The DNA tested, called autosomal DNA, represents the mix of all your ancestors. It remains useful to at least the six generations shown below, even further.

WAB's Six Generation Family Tree

Look at the grandparents of WAB and you can define four distinct subgroups: Baker, Woods, Perkins and Nicklos. In DNA and geographic terms, each subgroup is quite unique. During the 1800’s, the Bakers lived primarily in New York, the Woodses lived in western Pennsylvania, the Perkinses settled Ontario emigrating from Nova Scotia and Scotland (Jardine), and the Nickloses immigrated to Canada from Scotland (McDowell) and Saxony, Germany (Nicklos). Since each subgroup is so distinct, it is useful to color code the four different subgroups with navy blue for Baker, red for Woods, yellow for Perkins and green for Nicklos, abbreviated N, R, Y and G respectively.

The use of subgroup names, while convenient, can be misleading. A Jardine, Vansickle, McKechnie, Creelman, Minor or Gray might feel a little slighted sitting in the Perkins subgroup. As an alternative, let me introduce generic light blue and pink color codes, abbreviated B & P, representing a father’s and mother’s DNA, respectively. Using this coding scheme, the sequence of YBP represents the DNA of Olive Perkins’s father’s mother, better known as Mary Vansickle. She, and all her brothers and sisters, as well as all their descendants, share the same common ancestor, James and Susan (Minor) Vansickle. Notice that color codes get longer with more distant relations.

Helen Josephine Woods
Olive Jean Perkins
Ernest James Nicklos

DNA Matches
As a first pass, AncestryDNA shows everyone who shares DNA with you. The amount of shared DNA is measured in centimorgans (cM). It starts high and decreases rapidly with the generations. At some point, you share so little DNA that it’s possible that the match represents pure random chance, not a true relationship (a “false positive”). Per the lower right table, 30 cM represents a good conservative cut-off, giving about 95% confidence that the match is related to you. Later analysis will use a 20 cm threshold to look for additional matches. However, the table suggests that the risk of finding a false positive approaches 50%. Keep in mind that DNA results represent one part of a genealogy proof, which includes traditional evidence such as vital, probate and census records. While supporting documents are always needed, the need increases when using 20 cM DNA. WAB’s family tree is very important to our analysis because it contains references to that traditional supporting evidence.

Scroll through the bottom left image from ancestryDNA to show the top DNA matches through “third cousin”. AncestryDNA will estimate the relationship based on the amount of shared DNA. Some users also provide family trees. Trees can be linked, unlinked or private. AncestryDNA will determine a “common ancestor” to linked, nonprivate trees. Each of the individuals is definitely related to WAB based on the large amount of shared DNA all of which exceed 90 cM.

Confidence ScoreApproximate amount of shared cM'sLikelihood of a single recent common ancestor
Extremely high> 60 cMsVirtually 100%
Very High45 - 60 cMsAbout 99%
High30 - 45 cMsAbout 95%
Good16 - 30 cMsAbout 50%
Moderate6 - 16 cMs15 - 50%

The Shared Match
So you share data with someone else, but what is the connection? More accurately: Who are the common ancestors? AncestryDNA has a very useful tool to help you identify the DNA that we share with another person called the “shared match”. Let’s say you are Person A. You select a person who shares DNA with you. Call them Person B. Shared matches shows all others who share DNA with Persons A & B. 

The scrolling image to the right shows all DNA shared down to 20 cM with someone managed by MNeff. This person must be a close relative since they share 253 cM of DNA. Ethel (Baker) Neff, sister of our Harold J Baker, wrote a Baker family genealogy many years ago, likely making Everett and Helen (Hill) Baker our common ancestors. Color code-wise, MNeff is an N, and all the shared matches should also have an N. One would expect the shared matches to intersect with surnames like Baker, Hill, Blackmer, and Palmer, namely color codes like NB, NP, NBP and NBBP. 

Determining a shared match involved some art mixed with the science. AncestryDNA uses a propriety computer algorithm to determine a shared match. Algorithms can be tricked, so a predicted match is fallible. A better technique would involve chromosome maps, the current gold standard for evaluating shared matches. AncestryDNA does not provide these maps citing privacy concerns. Yet, ancestryDNA has the the largest set of user submitted trees and DNA. Hope springs eternal that ancestryDNA changes its policy.

Tons of shared matches exist, making it tedious to analyze all of them. Fortunately, two tools can make this process much easier: ThruLines and Genetic Affairs.

ThruLines
ThruLines combines user-submitted trees along with DNA matches to group individuals. So two people can share very little DNA (well under 10 cM), but still show a match because their trees overlap. ThruLines can produce impressive trees, and has a lot of potential to expand the current tree. However, ThruLines has a bad reputation in the research community. It requires a family tree on AncestryDNA, some many of which perpetuate errors. Not surprisingly, misleading results continue to surface when you cross someone’s small, random DNA match and their flawed tree. AncestryDNA compounds the problem because they did not have system for fixing obvious errors.

For me, ThruLines has proved useful because it allows me to analyze DNA under 20 cM. Below is a series of ThruLine charts for WAB, from James Baker to Mary Gray. Some trees have lots of matches, others not so much. Later I will use ThruLines to check some “what if” scenerios where you can postulate a relationship, and then see how people match.

Notice that these Thrulines cover a subset of available shared matches – those who have provided a useful tree. ThruLines do not get generated for matches who do not provide enough of a tree. Many times, I can fill in the gap and generate a similar chart. To differentiate them, allow me to modestly call them a “TrueLine” because the reader should have better confidence in their accuracy.

Genetic Affairs
This third-party utility forms a series of “clusters” from all the shared matches. In Mom’s case, the Baker family clusters would be very different than the Woods, Nicklos and Perkins clusters. No family trees are used to create the clusters. However, if you can identify one common ancestor, then everyone in that cluster should be related to that person. It’s a great way to examine the data. Click on the button below to see Genetic Affairs in action. 

The drawing to the right shows clusters 1 and 2.  Notice that the chart has perfect symmetry along the its diagonal axis  (The information may be a little redundant, but the charts look fabulous). Cluster 1 has 12 members. The first member, C.V, shared DNA with the other 11. The second member, L.W., shares DNA with everyone but D.K. I have not, to date, paid any attention the relational pattern within a cluster. It’s pretty obvious that an entire family associated with PeggyADK has tested. Some Members (L.W…, MizCherie, and Susan Maddock) of cluster 1 share data with cluster 2, so the two clusters are somehow related.

How does Genetic Affairs decide when cluster 1 ends, and 2 begins? It’s magic. Actually, it’s another computer algorithm. As mentioned earlier, algorithms can be fooled and you will occasionally see misplacement of members into the wrong cluster.

Shared Matches in Clusters 1 & 2

The cluster chart was further enhanced on the left side of the graph by showing the common ancestors, all identified from WAB’s Tree. For example, look for the sequence RBP in cluster 2 in the Woods subgroup. That member provided enough information that I learned that they descended from a brother of Jemima McLaughlin. Therefore our common ancestors are Patrick and Elizabeth (Smail) McLaughlin.

Genetic Affairs Cluster Diagram for WAB

An obvious pattern emerges based on the WAB’s four grandparents where clusters 1 to 8 form a supercluster corresponding to the Woods subgroup, clusters 9 to 13 forms the Baker supercluster, clusters 14 to 19 forms the Perkins supercluster, and clusters 20 to 22 cannot yet be identified. Do not underestimate the significance of the various scattered gray dots because they suggest that two clusters are related. The exact supercluster boxes are subject to interpretation. For example, Perkins supercluster could have been included cluster 20 based on a single gray dot outside the yellow box. Overall, WAB’s DNA offers a textbook example of a “clean” Genetic Affairs cluster chart.

  1. The Woods supercluster is distinct from the Baker supercluster and the Perkins supercluster.
  2. Within each supercluster the most closely related descendant lies in the upper left quadrant; the least closely related is located bottom right. For example, the Woods supercluster starts at Cluster 1, color code R, and ends at cluster 8, a RPPB. Although Genetic Affairs behaves like it knows WAB’s tree, it simply orders the clusters by the amount of shared DNA. Cluster 1 shares the most DNA with WAB, Cluster 8 the least near the 30 cM threshold.
  3. The clusters within the superclusters show various common ancestors. In the Woods supercluster, Cluster 1 is a R, Cluster 2 is a RBP or RBPB, Cluster 4 is a RP, Cluster 5 is a RBB and cluster 8 is a RPPB. You can look up the various common ancestor on the tree above.
  4. No extraneous gray dots. The superclusters account for all of them (spoiler alert: I have since discovered that cluster 20 should be included with the Perkins supercluster).

Each cluster diagram is unique, and tells a slightly different story. What’s that NNNN sequence dominating cluster 13 of the Baker subgroup?  I don’t know yet, but they all the members point to a guy named Elijah Fuller Knapp. Stay tuned for later essays focused on the each subgroup. Hopefully, I can answer the question by the time I write the article..

Conclusion
WAB’s DNA provides excellent understanding of her Baker, Woods and Perkins trees. While the Nicklos/McDowell lines remain missing, all is not lost. We have some good places to look, starting with the mystery clusters 20, 21 and 22. Also, Genetic Affairs listed 9 samples above the 30 cM threshold that are loners, and not part of any cluster. Results of these mystery matches will be left to the next article.